The LS Insight Hotels report contains three report pages, two that show the Hotel KPIs and visuals, and one with help and acronym definitions.
The report has several filters available for all report pages and some that only apply to one report page or visual.
You can remove, add, and manage these filters in Power BI desktop before publishing the report to Power BI service and distributing it to users throughout your organization.
Hotel Overview
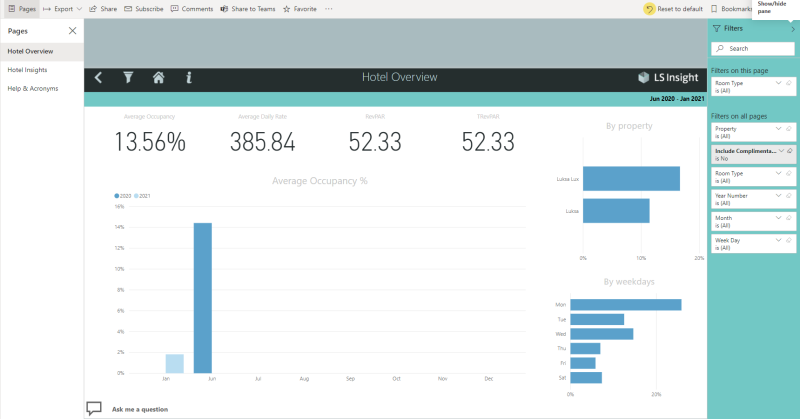
The Hotel Overview report page shows a comparison of Average Occupancy percentage between years, by property and by weekdays. It also shows averages for four other Hotel KPIs for the selected time period. These can be adjusted using the filters in the filter pane on the right. If no filter is set, the report shows all existing data. The filter pane can be shown or hidden by the Power BI service user.
The KPIs are:
- Average Occupancy %
- Average Daily Rate
- Rev PAR
- T Rev PAR
Hotel Insights
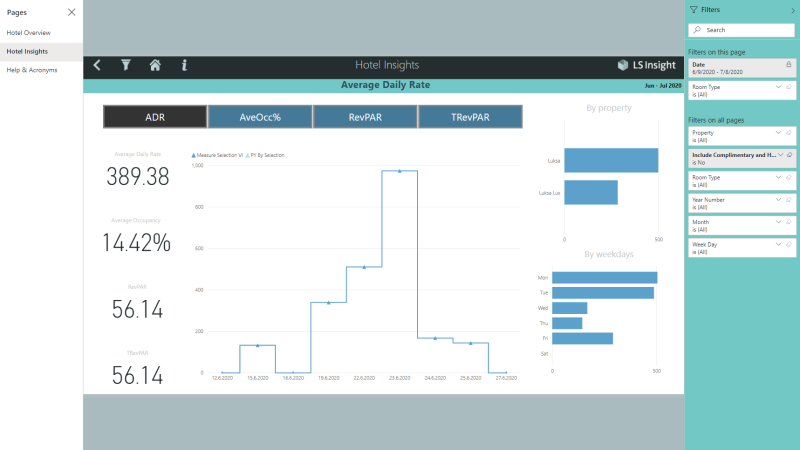
The Hotel Insights report shows the same KPIs as the first report. It also shows a visualization for the different measures over time and with comparison to the same period in the previous year.
As you can see in the above image, the Date filter on this page is locked and by default set to the last 30 days. To change this setting you need to edit the report in Power BI service or desktop and change or unlock the filter. Note: There is also a date filter set directly on the main visualization showing the measure selection.
Tip: To change the date scale on the main visual, you can also drill up and down in the date hierarchy. Use the arrows that are displayed at the top of the visual, when you hover over it in the Power BI service or desktop.
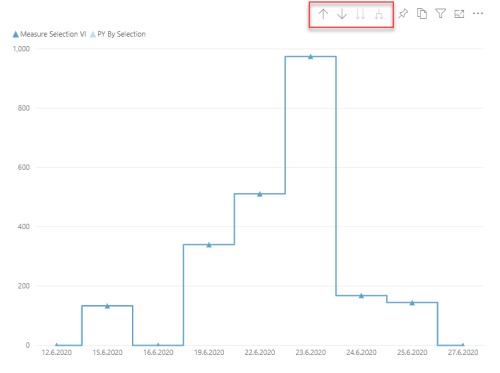
To drill up to weeks, months, and years you use the up arrow. To drill down from years to months, use either of the down arrows.
Help & Acronyms
This report page displays all acronyms used in the report and their descriptions and details.